Network Analysis of Live Mouse Brain Neuron Activities
A mixed network model in both Cross-Correlation based and Causal Bayesian Network based approaches for analyzing interaction between brain neurons for various states of mice which were watching on different visual patterns
Abstract
Modern brain mapping techniques are producing increasingly large datasets of anatomical or functional connection patterns. A datasets of videos recorded from ten mice’s brain neuron is provided in this project and multiple methods of network analysis are used to model the mouse brain neuron network. To find out the network topology as an undirected graph model, a cross-correlation based method is proposed and multiple thresholds are chosen to adjust the model. Considering the causality of the brain neuron network, a score-based algorithm is implemented to learn the neuron network’s structure as a causal Bayesian network. Then, network clustering is conducted to separate the mouse brain neurons as interconnected functional groups. Conclusions about mouse brain neuron network topology and functional segregation are drawn after several verifications and simulations of the proposed models and algorithms.
Paper
Jui-Hsin(Larry) Lai , Ruichi(Rich) Yu, and Ching-Yung Lin, “ Neuron Activity Extraction and Network Analysis on Mouse Brain Videos ”, in Proceedings of IEEE International Symposium on Multimedia, 2016
Introduction
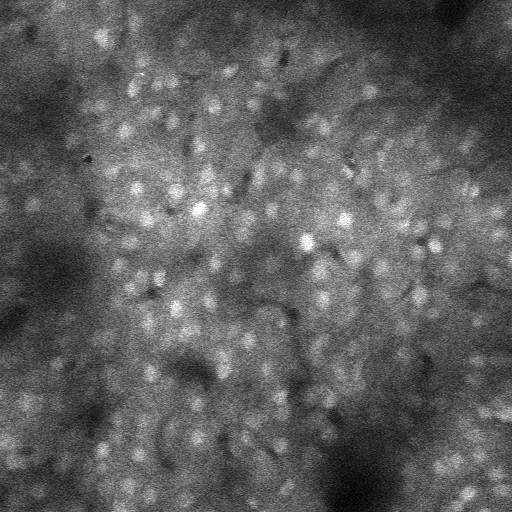
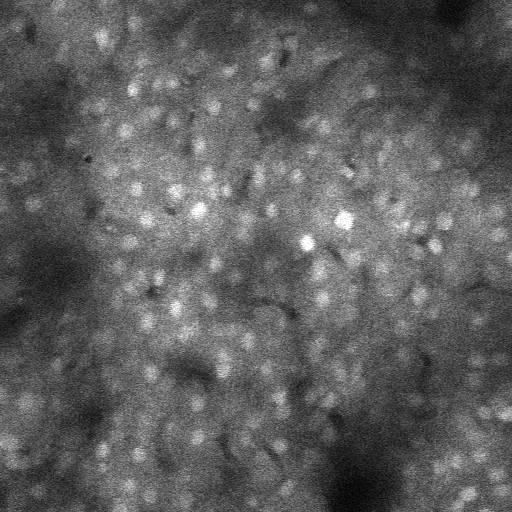
The IBM System G Brain Network Analysis tool currently detects possible neuron locations and radius from calcium neuron imaging videos of mouse brains. The tool tries to normalize and register neuron events by compensating the background variants of brain movements and activities. It detects the firing of neurons. By mouse over an individual neuron, neural scientists can exam the luminance changes and detected firing of individual neuron.
The tool analyzes the frames that the neurons are active and construct the dependency graphs of brain neurons based on collective and causal activities of neurons based on the same stimulus.
The current dataset we are working on are from live mice looking at different image patterns:
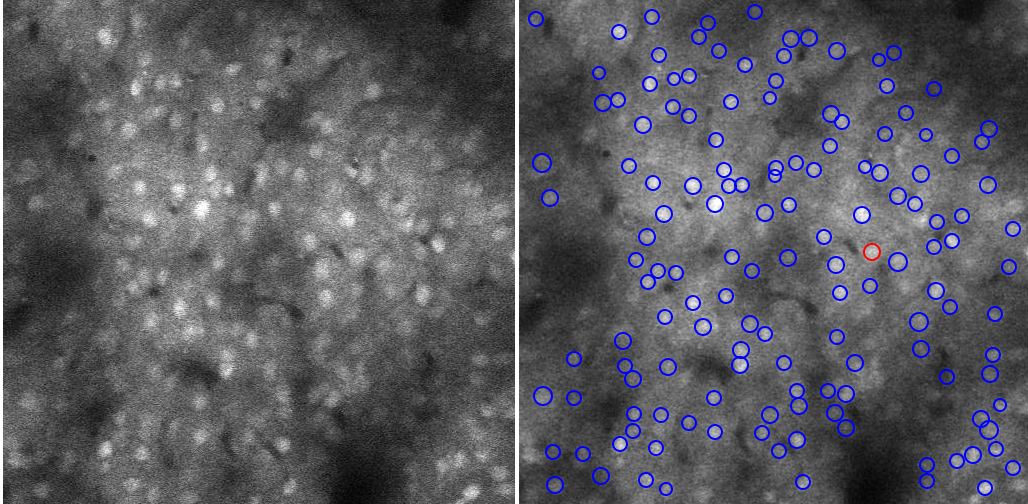
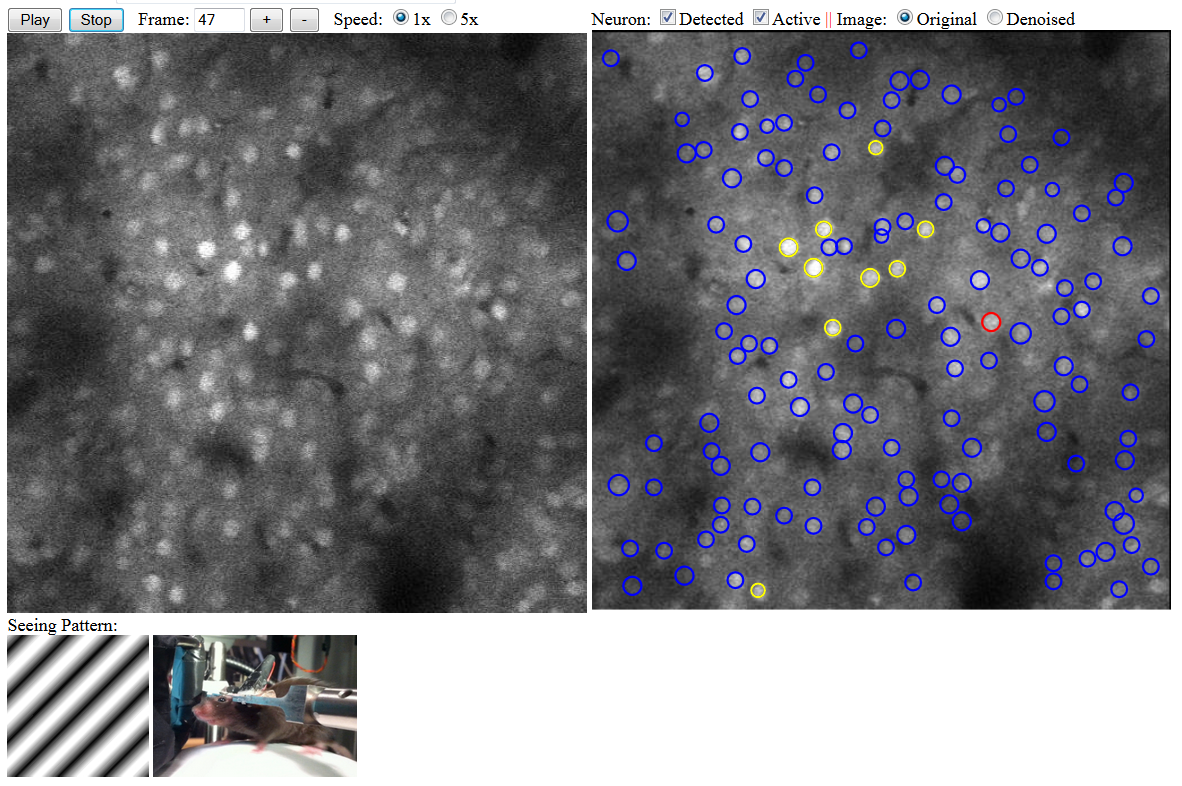
The following figure shows an example of calcium brain neuron image and the detected neurons. The blue circles are detected neurons (or, more precisely, the "Regions of Interest -- ROIs"). The red circle inidiates the signal analyis of the neuron that is being shown on the interface.
In the below figure, you can see the yellow circles are the detected neurons that are in the firing status. The left hand side shows the control of video playing of the original sequence, with the current frame number and the 1x and 5x playing speed. In the right hand side, the analyst can choose to see detected and/or active neurons on the background of the original video or the denoised/normalized video. In this figure, the mouse was seeing a moving diagonal pattern with the stripes angled at 45 degree and the direction of movement was 135 degree.
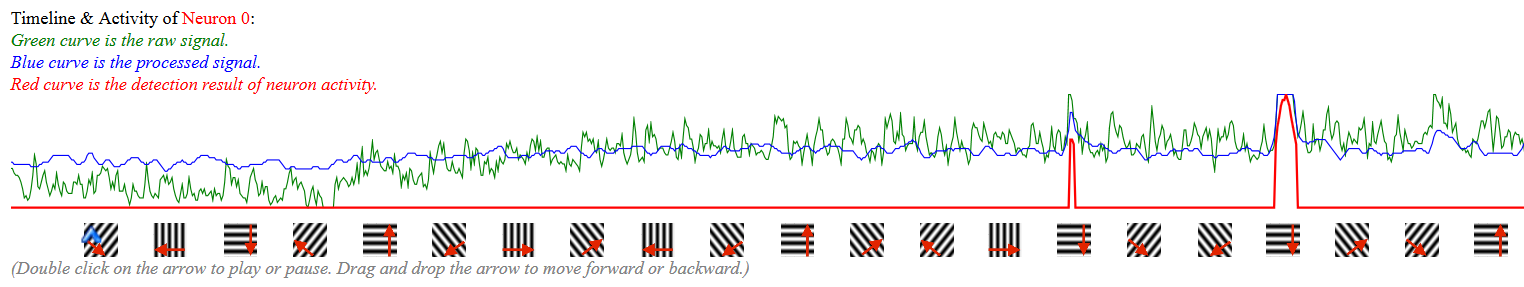
When an analyst clicks on a neuron, she can see the raw signal, processd signal, and the detection result of that region of interest throughout the entire experiment that consists of alterate periods of mouse seeing different patterns and seeing nothing. This function can help analyst have a clear view on the neuron activity through different stimulus.
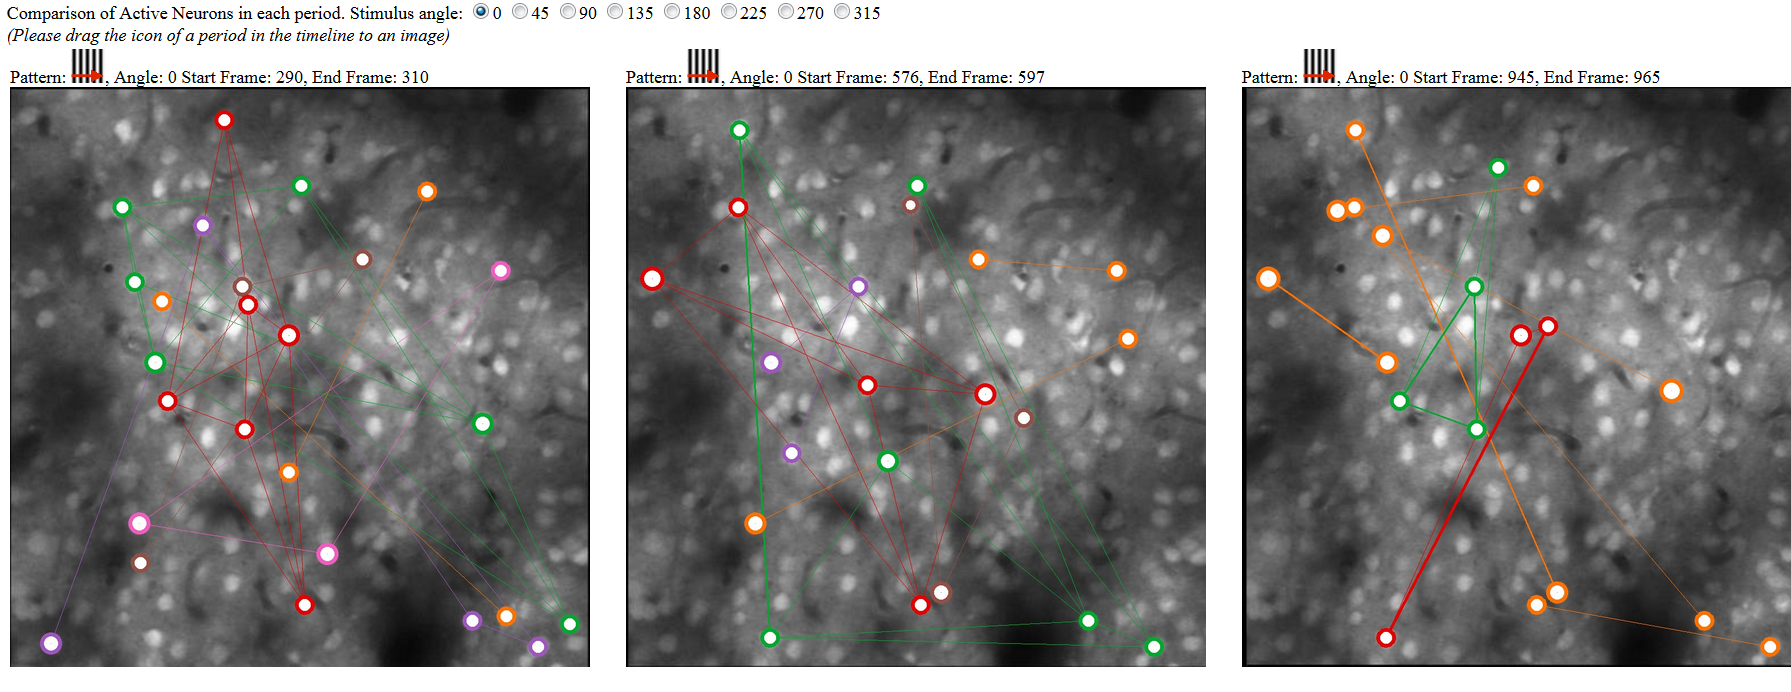
At the bottom of the tool includes three canvases to allow analyst to drag and drop any period to compare the detected neuron network of that region. It can help analyst to examine whether the neurons showed similar (or related) networks based on similar types of stimilus. The color of the neuron circles indiates a cluster (connected component) in that period. The linkage was created based on the firing at the same time.
Demos
Note that the demo will have better visualization under 1920 x 1080 resolution screeen.
Frame:
Speed:
1x
5x
|
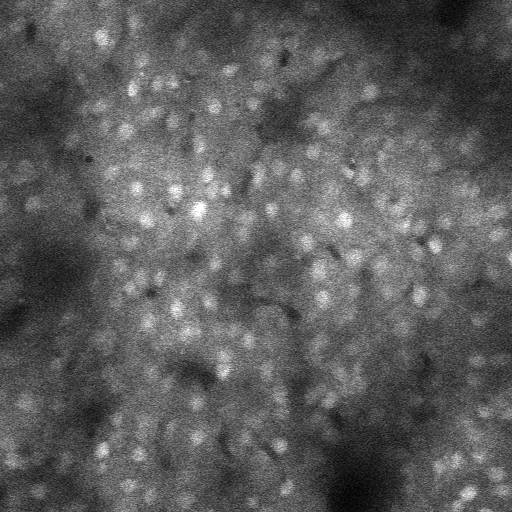
Neuron: Detected Active || Image: Original Denoised | Fluorescence Image | |||
Seeing Pattern:
|
|||||
| Timeline: | |||||
| (Double click on the arrow to play or pause. Double click on patterns to move the arrow forward or backward.) | |||||
|
Comparison of Active Neurons in each period. Stimulus angle: 0 45 90 135 180 225 270 315 (Please drag above patterns on top of following images to see the network analysis.)
|
|||||